@everyone - Alpha Lab Update 📣 📣
Follow along with our latest Alpha Lab guide to build custom scanpath visualizations. 👀
Scanpaths are graphical representations of fixations and saccades over time. They show how a person has looked at different aspects of a scene, and in what order, making them useful for understanding visual attention and perception.
🔎 Key features: - Builds on results from Pupil Cloud’s Reference Image Mapper and Manual Mapper enrichments. - Runs in Google Colab for quick and flexible visualizations, with an option to run scripts locally. - Supports generation of both static and dynamic (video) scanpath visualizations, depending on your requirements.
Check it out: https://docs.pupil-labs.com/alpha-lab/scanpath-rim/#generate-static-and-dynamic-scanpaths
@everyone, check out Neon in action at our hands-on tutorial on wearable eye tracking at the European Conference on Visual Perception (ECVP) 2024!
To those who attended, thank you for joining, we really had a blast!
The video shows a first-person view, with gaze and fixations, of a participant searching for a book at the University of Aberdeen.
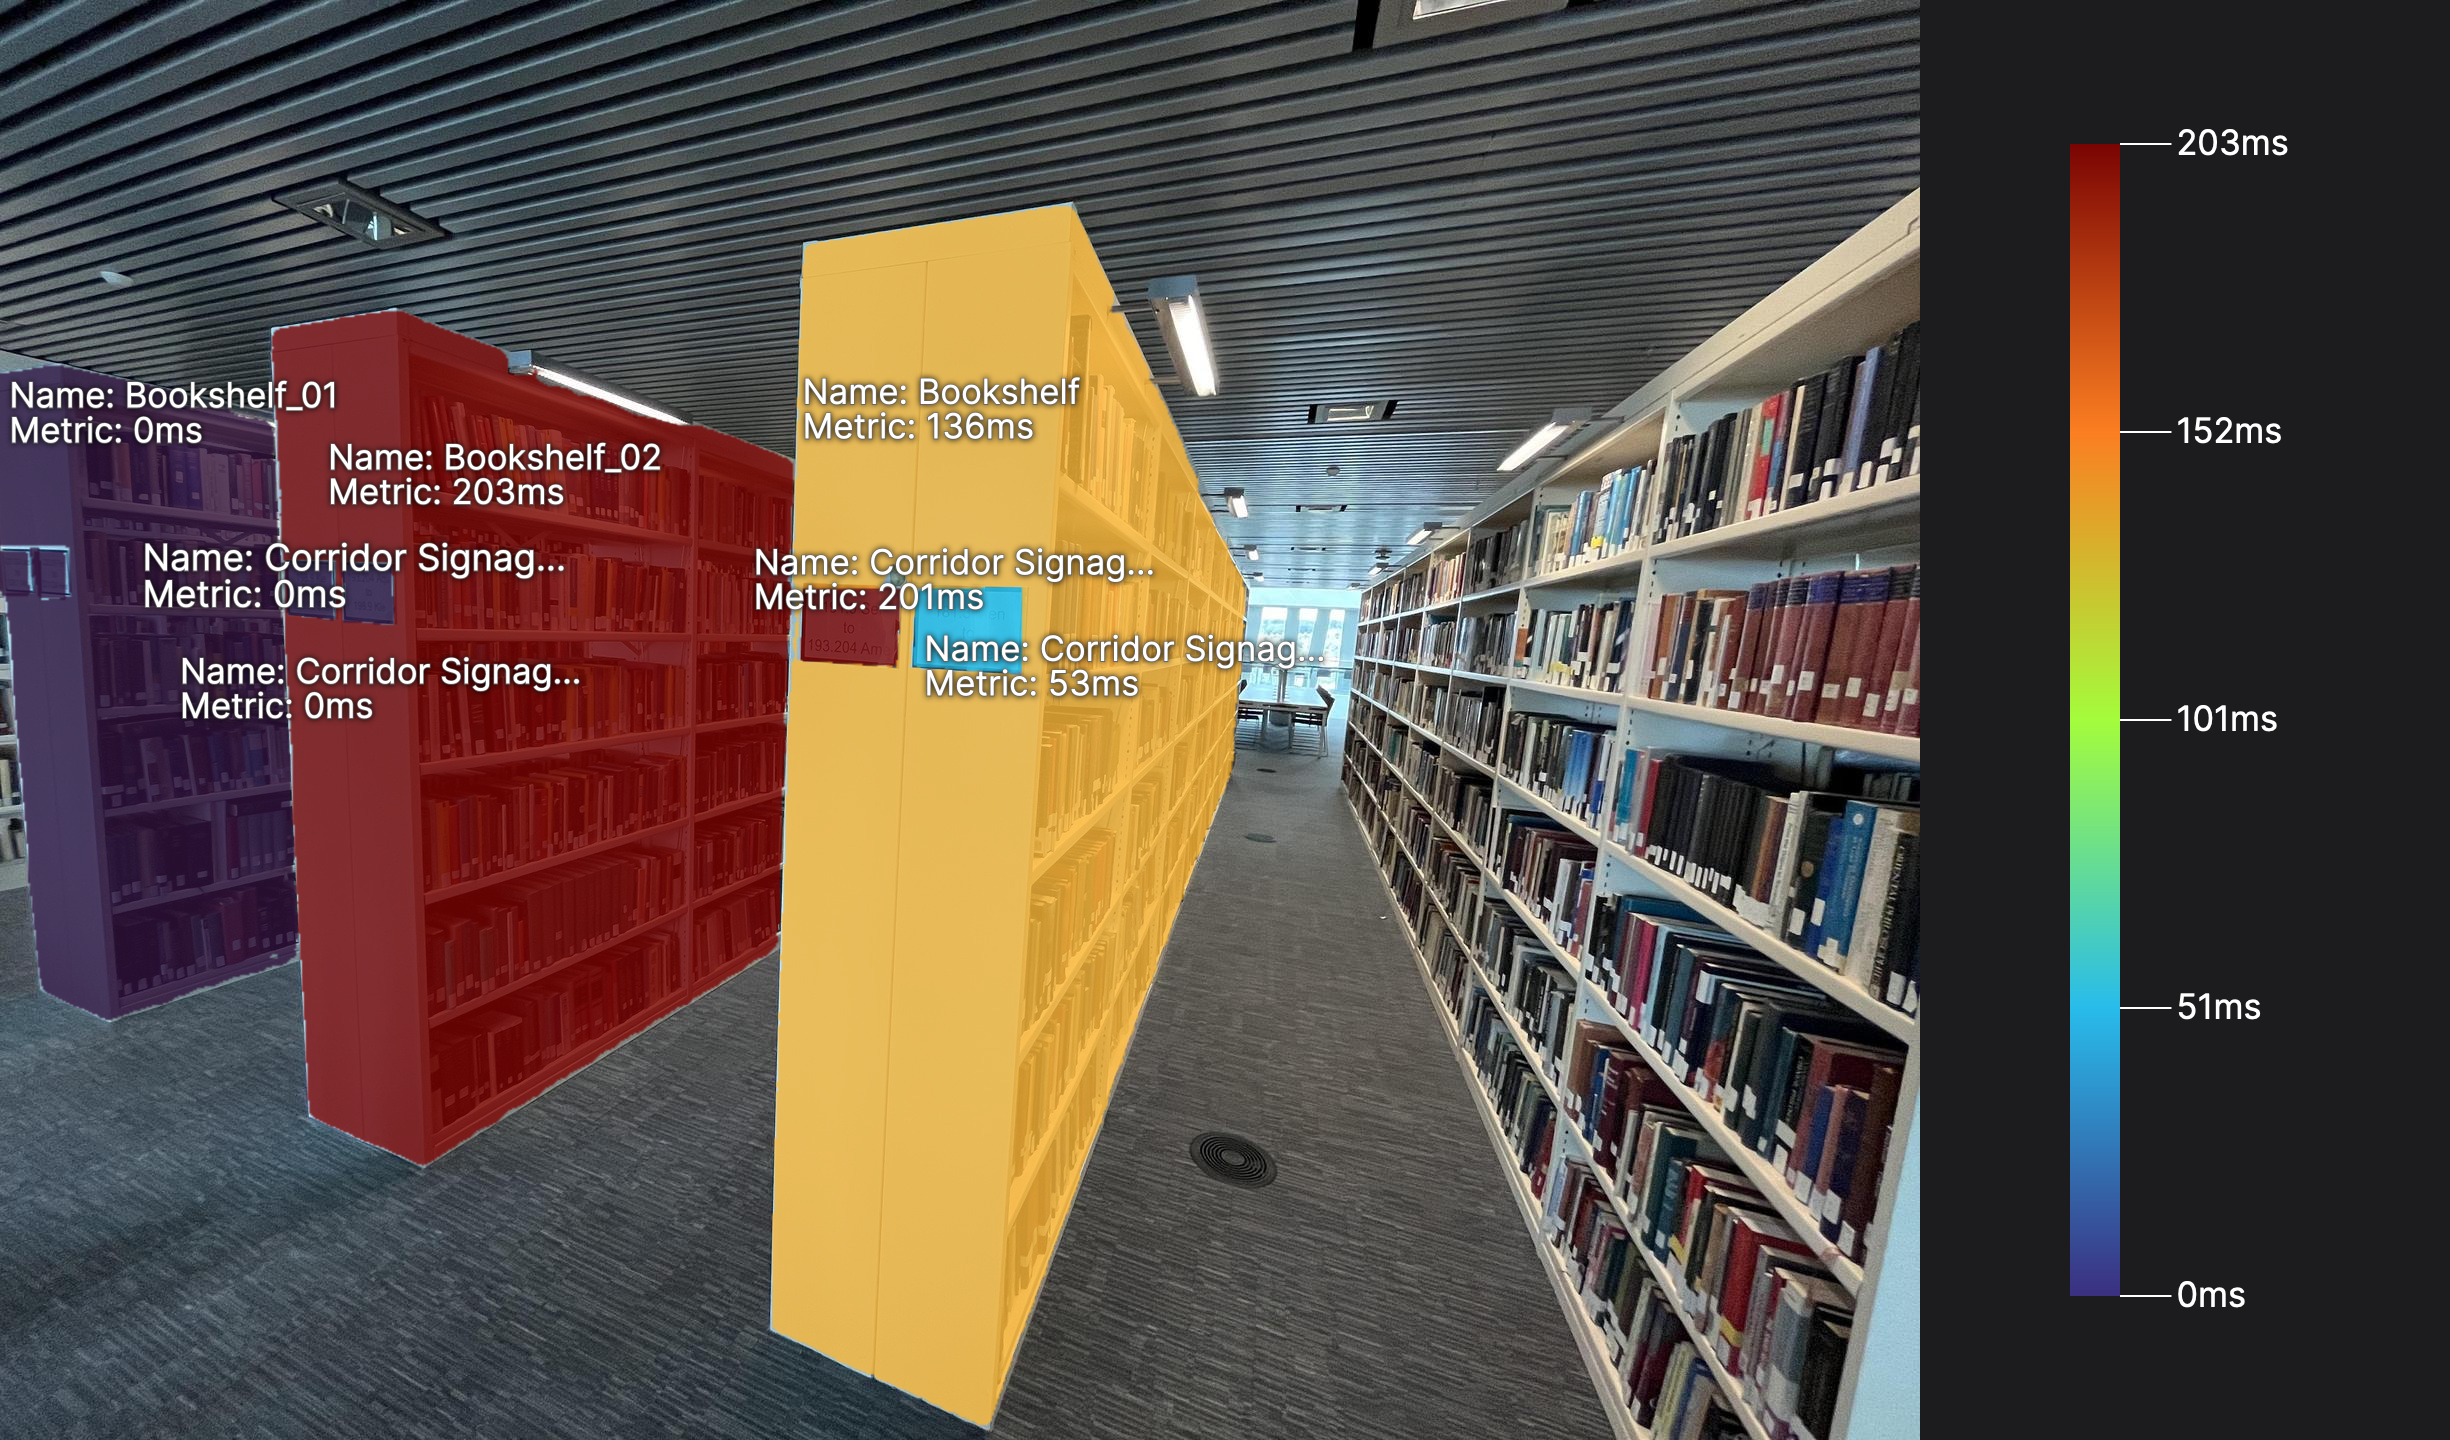
We used Pupil Cloud's Reference Image Mapper enrichment to automatically map fixations onto features of the environment and generate aggregate metrics from multiple participants.
We drew Areas of Interest (AOIs) on the bookshelves and Pupil Cloud automatically provides a variety of metrics. This image is a visualization of average fixation duration in milliseconds, providing insight into which bookshelves and signs attracted attention as the participants searched for a book.
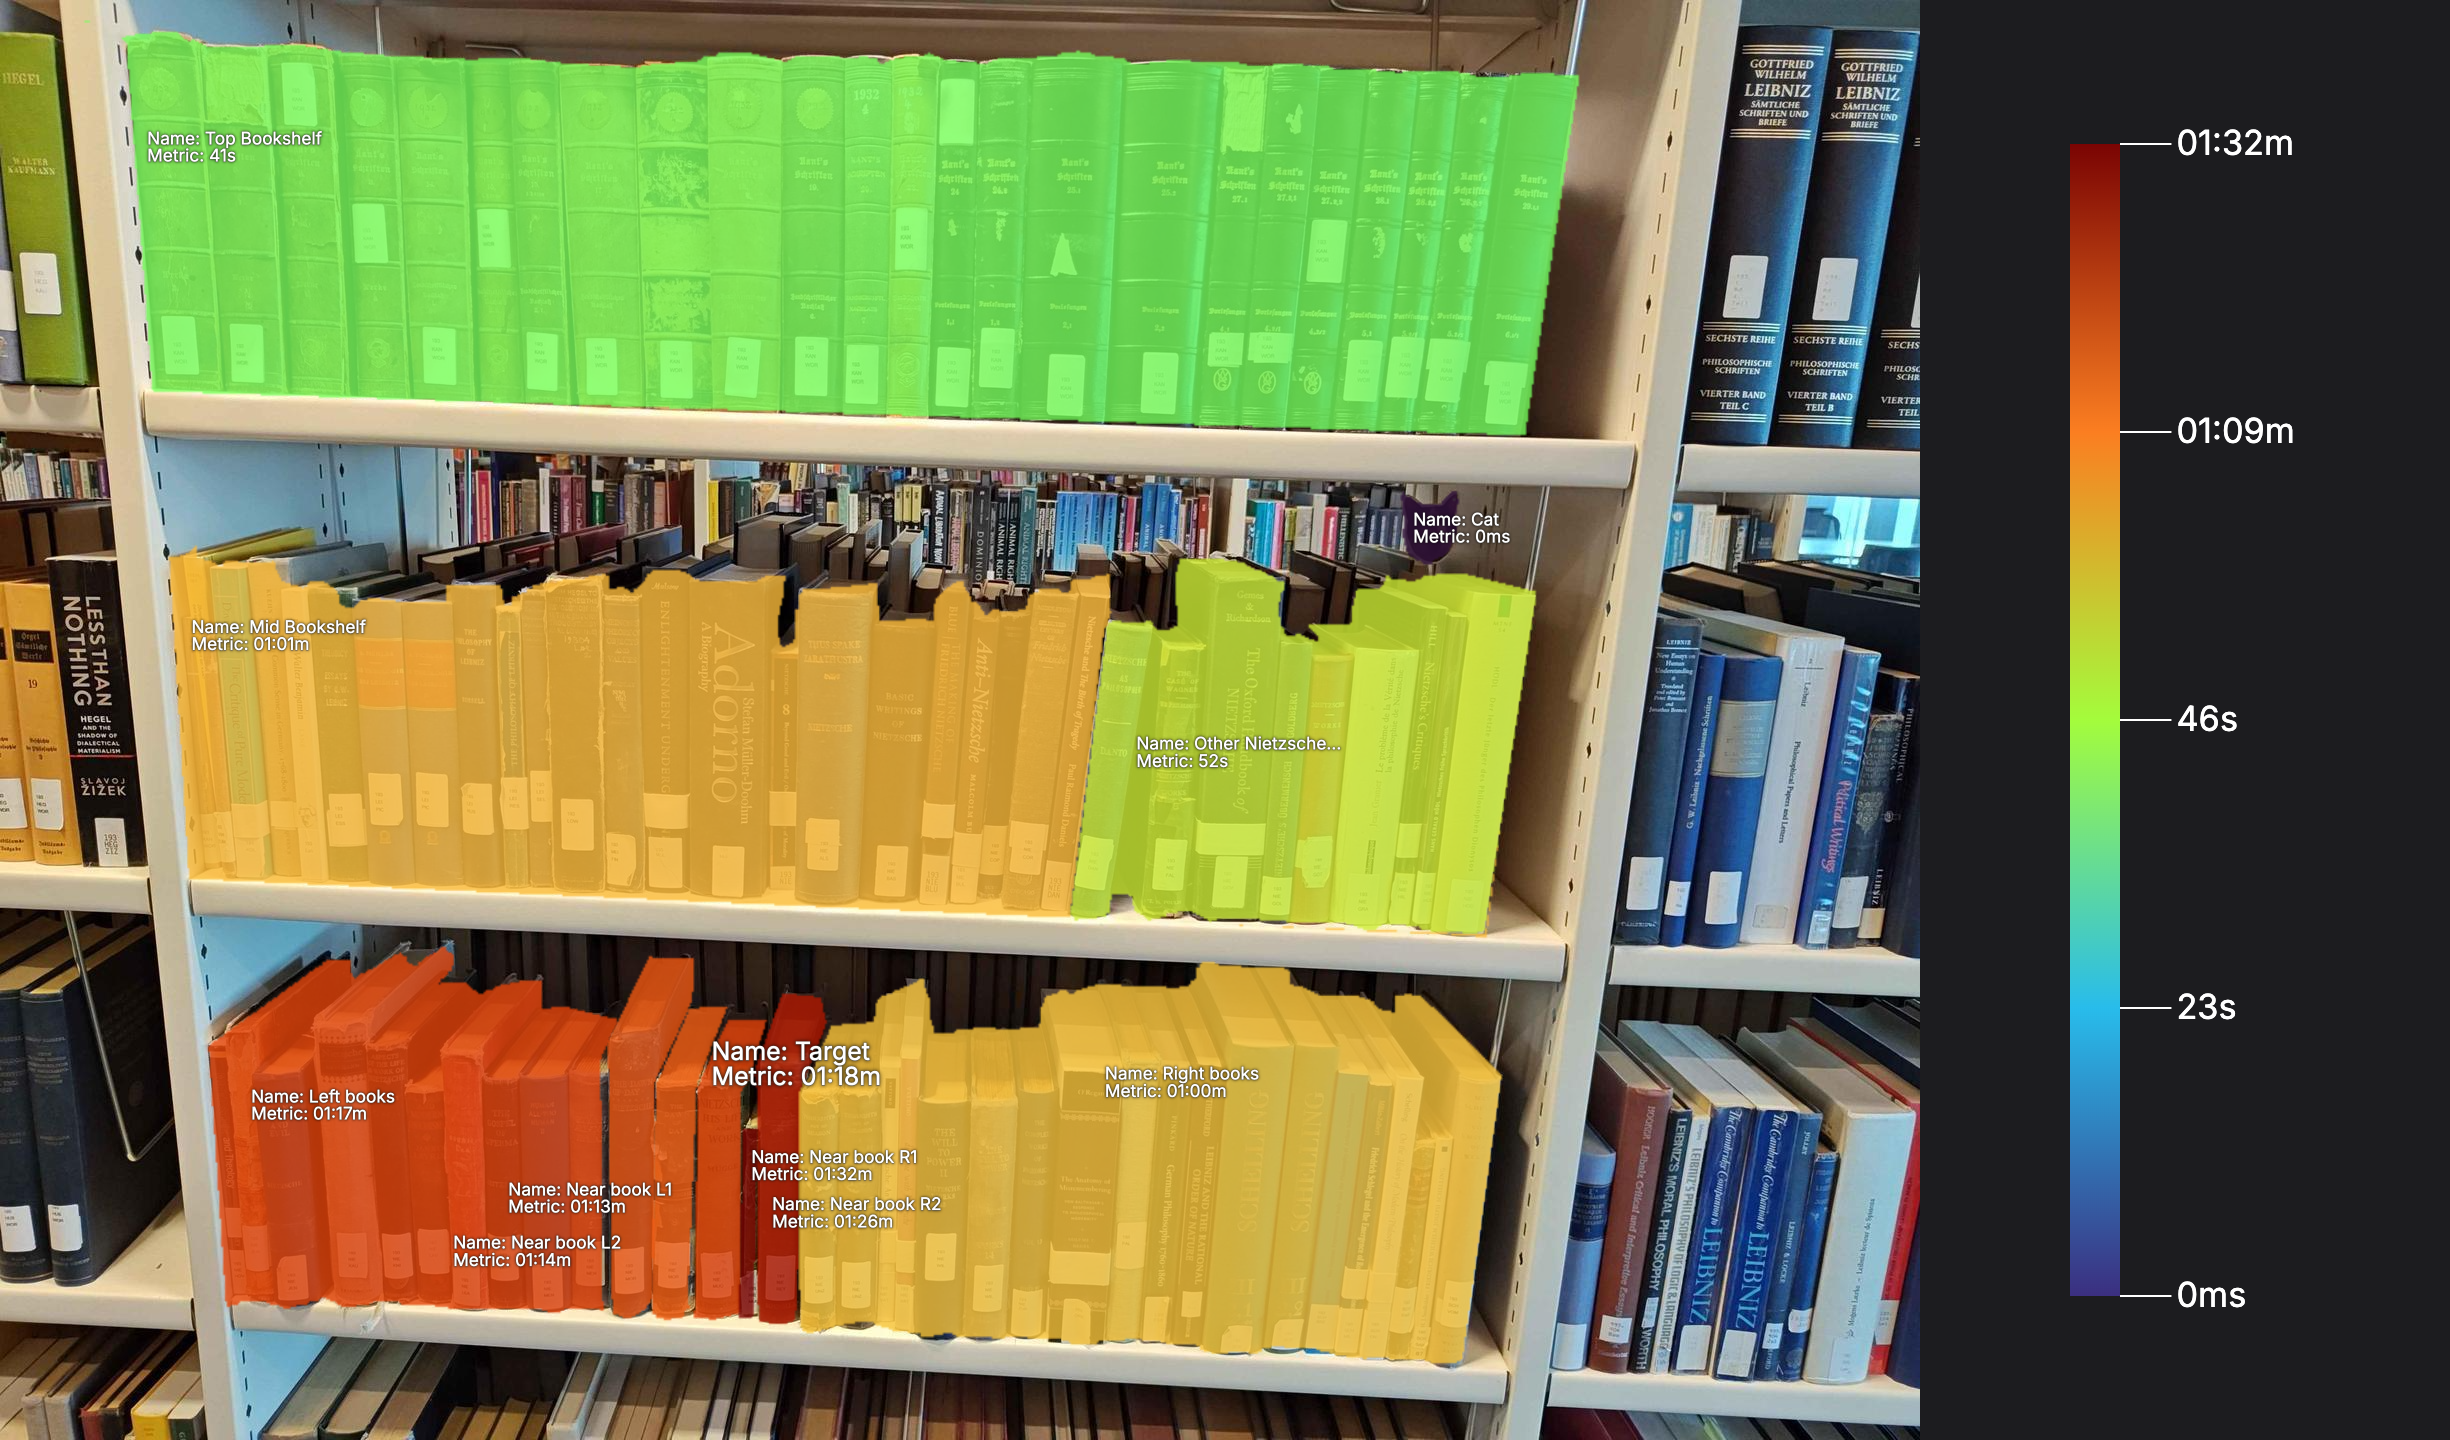
Here is another AOI visualization. We can see which areas of the bookshelf - down to individual books - attracted more attention during the search task. Notice how the target book is highlighted in red, demonstrating it drew the most attention!
We’ve just wrapped things up at this year’s ECVP. Thanks to everyone who attended the workshop and and stopped by to get a hands-on demo of Neon!